Science doesn’t work by guessing. It works based on structured predictions. In particular, it is based on hypotheses. But not all hypotheses are created equal. To decide what type of hypothesis to use in your research, you need to know the difference between a null hypothesis, an alternative hypothesis, and a research hypothesis.
A hypothesis is simply a possible, objective and precise answer to a scientific question. The catch? Must be testable. You have to be able to prove it wrong or right. Without the ability to confirm or disprove it, it’s just an opinion.
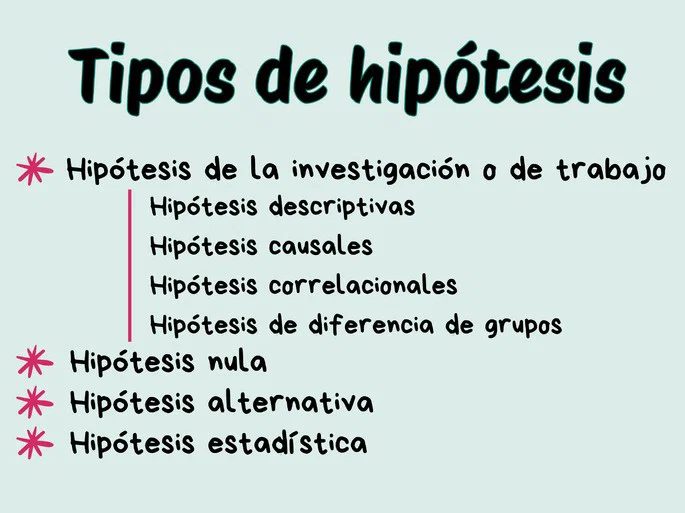
The main types are classified as follows.
Research hypothesis
This is the first thing most people think of. The Research Hypothesis (sometimes called the Working Hypothesis) is your best guess about the outcome. This is a description of the expected relationships between the variables.
If you are studying the effects of sleep on memory, your research hypothesis might be: “People who sleep 8 hours remember more facts than people who sleep 4 hours.”
It’s very direct. It’s specific. This is what you want to find. But rigorous science rarely tests this directly without considering the opposite.
Null hypothesis
Enter the null hypothesis. This is the most commonly misunderstood part of statistical testing. The null hypothesis states that there is no relationship between the variables.
Using sleep as an example, the null hypothesis is that there is no difference in memory retention between people who sleep 8 hours and people who sleep 4 hours.
Why should scientists care about this? Because science advances by disproving things. Start by assuming nothing happened. If the data is strong enough, you can reject the null hypothesis. If you can’t reject it, you’re probably saying that nothing important is happening. This is a protective measure to prevent the patterns from appearing in the noise.
Alternative hypothesis
Rejecting the null hypothesis leaves us with an alternative hypothesis. This is the logical opposite of the null. If the data has a significant effect, it is a conclusion.
In our sleep study, if the null value is “no difference”, the alternative is “difference”. It is not necessarily directional (like a research hypothesis), just that a relationship exists.
Statistical hypotheses
You may hear the term statistical hypotheses. This is broader. This refers to claim about a population parameter being tested. Null hypothesis and alternative hypothesis are both types of statistical hypothesis.
Think of it as an umbrella term. When you do a t-test or Chi-square test, you are technically testing a statistical hypothesis.
Why this distinction is important
You might wonder why we need so many labels for similar concepts. The answer lies in clarity.
By expressing your research hypothesis clearly, you know what you are looking for. If you clearly state your null hypothesis, you know what you want to disprove. your data analysis becomes a mess.
- Research Hypothesis : Your own prediction.
- Null Hypothesis : Hypothesis that there is no effect.
- Alternative Hypothesis : The conclusion if the null is rejected.
Understanding how they interact can prevent sloppy science. that
Most people think that research starts with mere speculation. That’s not how science works. Research often involves several assumptions. They do not exist separately. they interact.
The working hypothesis guide projects. It is the main engine. But it relies on backup systems to prove its worth. Null hypothesis, alternative hypothesis and statistical hypothesis act as filters. They remove the noise. They help isolate key facts.
Let’s break these components down. Let’s look at the characteristics of each type and where they appear in real data.
Working hypothesis: starting point
The working hypothesis (or research hypothesis) is the starting point. It maps the relationship between variables. It’s not just a list. Predict how they are related.
Hypotheses can be classified according to their focus. Is it descriptive? Causing? Correlating? Or are you comparing groups?
Descriptive Hypotheses
These are very simple. They describe the state of things. They do not explain why. They just tell you what to expect.
Think of it as a snapshot. You anticipate the value. You will notice these features. You skip the causal link.
Example: «Crime in Caracas has increased by 50% compared to 2019. »
This statement is about trends. It does not argue that poverty or policy changes are to blame for the rise. It’s just that the numbers are on the rise.
Causal hypothesis
Here you will get into the meat of science. cause and effect.
These hypotheses state that one variable directly affects another variable. They can be explanatory or predictive.
Explanatory hypotheses Get to the heart of it. They offer a reason for the link.
* Example: «Excessive alcohol consumption causes neuronal damage. »
This will tell you “why” the damage happened. It suggests a biological mechanism.
Predictive hypotheses look forward. They predict behavior based on current trends.
* Example: «Global warming will cause floods in the next few years. »
This is a projection. This assumes that the current trajectory will continue.
Both types can be constructed using two different logical paths: deductive or inductive.
Deductive hypotheses move from the general to the specific. Let’s start with the theory. Let’s apply it to the case.
* Example: «All living things have DNA. Bacteria are living things. That’s why bacteria have DNA. »
This is linear logic. If the premises are true, the conclusion must also be true.
The Inductive Hypothesis works the other way around. From specific to general. You observe a pattern. You build a rule.
* Example: Newton saw an apple fall. He observed the orbit of the moon. He noticed the difference. One of them fell to the ground. The other stayed up. He induced a general law of gravitation.
He didn’t start with the law of gravity. He noticed the effect. He guessed the reason. Then he tested it.
Correlational Hypotheses
Correlation is not causation. This is the golden rule.
These hypotheses measure the degree of association between variables. They ask: How strongly do they move together?
The order of the variables does not matter here. If A affects B, then B affects A in a correlational sense.
Isaac Newton’s law of universal gravitation is actually correlational in its statement.
* Device: «The greater the mass, the greater the attractive force. »
Read it backward: “Greater attractive force means more mass.” The correlation is in both directions.
These relationships can be positive, negative or mixed.
- Positive: “The greater the impunity, the higher the crime.” Both go up together.
- Negative: “Low fat intake reduces risk of coronary heart disease.” One goes down, another follows.
- Mixed: «The higher the altitude, the lower the temperature. » Inverse relationship.
Group difference hypothesis
Sometimes you don’t look for trends. You’re looking for a split.
These hypotheses anticipate differences between groups. This is a statistical comparison.
There are two ways to write it.
- Non-directional: You state a difference exists. You do not say which group wins.
- Example: «There are differences in the mortality rates of men and women. »
- Directional: You specify the outcome. You name the group with a higher (or lower) value.
- Example: «Men have a higher mortality rate than women. »
The second version is risky. It commits to a specific outcome. If the data shows that the rates are higher in women, you are wrong. The first version is more secure. You’re just claiming that there are “some” differences between them.
Null Hypothesis (H₀)
Science is inherently skeptical. Assume nothing happened until proven otherwise.
This is the null hypothesis. Denies relationships between variables. This is a negative statement. Contains the words “no” or “no”.
The symbol is H₀.
Does not “accept” null values. Either you reject it or you can’t reject it. The goal of most research is to eliminate zero.
Example: «BMI is “independent” of a person’s gender. »
This is the default location. There seems to be no relationship between muscle mass and gender. This study exists to combat this feeling of boredom.
Alternative hypothesis (H₁)
Each null hypothesis has a partner.
Another hypothesis. This is the other side of zero. It shows that the relationship exists.
The symbol is H₁.
If a null value means “no link”, an alternate value means “link detected”. Accept the option or not.
Match them up and see how excited they feel.
H₀: «BMI has nothing to do with gender. »
H₁: «BMI is different for men and women. »
Researchers collect data. They do statistics. If the evidence is strong enough, they reject H₀. These keep H1.
This binary structure is how science corrects itself. You must prove an exception. This prevents you from assuming patterns that don’t exist.
This is a tight frame. Some people feel cold. Some people find it liberating. Eliminate neutrality by forcing decisions. Is there a difference? yes or no. No, maybe it is.
The working hypothesis determines the direction. The null and alternative hypotheses provide a forum. Data is the jury.
When replacing words with numbers: statistical hypotheses
A hypothesis is not just a guess. At least not the ones that matter in hard data. Statistical hypotheses turn these vague ideas into symbols. Their purpose is to check or set parameters for one or more groups. You don’t use them when you plan to write a novel. It can be used when you want to collect large amounts of data. Percentages. Average. Any metric that can be plotted on charts.
Think of it as a bridge between question and a spreadsheet.
Three ways to measure the unknown
Not all statistical hypotheses are created in the same way. They fall into certain categories based on what you are actually trying to prove.
Estimation hypotheses does the heavy lifting of descriptive studies. These focus on one variable. Researchers try to estimate statistical results based on context. Instead of comparing things, it is important to define the current situation. If you want to know the average height of a certain group, this is the perfect tool. This is a snapshot.
Correlation hypotheses Look for associations. They study the relationship between two or more variables. do they move together? Does one change when the other does? This is not a cause and effect. It’s about association. If ice cream sales and shark attacks spike in July, the hypothesis would be such a association. Whether one leads to the other is another matter.
The comparison uses the Differences in means hypotheses. These deal with group differences. This analysis compares numerical estimates between two or more groups. Does the new drug work better than a placebo? Did the marketing campaign increase sales in area A but not area B? This type of assumption looks for the gap. The difference is discovery.
Why This classification is important
These distinctions may seem academically pedantic. They aren’t. They determine how the math are performed.
If you choose the wrong type, your data will tell you nothing. After spending weeks collecting data, you realize you asked the wrong statistical question. The estimation hypothesis requires different calculations than a test of differences in means. Mixing these together will cause noise.
The goal is clarity. You can set study-wide parameters by specifying whether to estimate values, examine relationships, or compare groups. It filters out the irrelevant data before you even start collecting it.
This is the foundation of scientific rigor. Without these statistical frameworks, data is just clutter. With them, it becomes evidence.
The hypothesis is not the answer. It is the precise question that allows the data to speak.
The Human Element in the Math
There is a tendency to treat statistics as cold and objective. They are tools. But choosing the statistical hypotheses to be used is very human. It reflects what researchers think is important.
Do we care about averages? What are the associations between the factors? Difference between groups?
These choices shape the research narrative. In educational outcomes research, the difference in means hypothesis can be used to compare test scores between schools. Another approach could be to use correlation to determine whether household income is associated with attendance. Both are valid. Both are statistical hypotheses. But they tell completely different stories about the same world.
The symbol will appear. It is up to the people to decide which symbols are important.